Introduction
In the intricate world of computing, memory is the fundamental substrate upon which all operations are performed. From the simplest variable assignment to the most complex database query, every piece of data and every instruction lives, however fleetingly, within memory. However, “memory” is not a monolithic entity; it’s a complex, multi-layered hierarchy designed to balance speed, capacity, and cost.
Understanding the internals of how memory works is paramount for any serious developer or system administrator. It demystifies performance bottlenecks, helps diagnose elusive bugs like memory leaks, and empowers the creation of more efficient and robust software. Without this foundational knowledge, one is merely guessing at the underlying behavior of their applications and the systems they run on.
This guide will take you on a deep dive into the internal mechanisms of modern computer memory. We will explore the critical distinctions between stack and heap memory, unravel the magic of virtual memory and paging, journey through the lightning-fast CPU caches, touch upon the basics of garbage collection, and uncover the perils of memory leaks, all while examining their profound performance implications. By the end, you’ll possess a robust mental model of how your programs interact with the hardware at a fundamental level.
The Problem It Solves
Early computing systems faced a stark reality: programs directly accessed physical memory addresses. This simplicity quickly led to a host of problems. Imagine multiple programs running simultaneously, each potentially overwriting another’s data, leading to crashes and security vulnerabilities. Furthermore, physical memory was a limited resource. If a program needed more memory than physically available, it simply couldn’t run.
The core problem statement was: How can multiple programs safely and efficiently share a limited physical memory resource, while each believing it has access to a vast, private memory space?
This challenge spurred the development of sophisticated memory management units (MMUs) and operating system (OS) features. The goal was to provide isolation, expand addressable memory beyond physical limits, and optimize data access speeds – all without burdening the programmer with low-level hardware concerns. The solutions we discuss today, like virtual memory and caches, are direct responses to these fundamental limitations and requirements.
High-Level Architecture
Modern memory architecture is a hierarchy, designed to leverage the principle of locality (data that is accessed once is likely to be accessed again soon, and data near accessed data is also likely to be accessed soon).
Component Overview:
- CPU Cores: Execute instructions and process data.
- L1, L2, L3 Caches: Small, extremely fast memory layers directly integrated into or very close to the CPU. They store frequently accessed data and instructions to minimize trips to slower main memory. L1 is fastest and smallest, L3 is slowest and largest among caches.
- Main Memory (RAM): Larger, slower, volatile memory. This is where most active programs and their data reside.
- Secondary Storage (SSD/HDD): Persistent, very large, but significantly slower storage. Used for storing programs and data when not in active use, and as a backing store for virtual memory.
- Memory Management Unit (MMU): A hardware component, typically part of the CPU, responsible for translating virtual memory addresses (used by programs) into physical memory addresses (used by RAM).
- Virtual Memory Space: Each running program (process) gets its own isolated virtual address space, making it believe it has exclusive access to a huge amount of memory.
- Stack Memory: Automatically managed memory for local variables and function call contexts.
- Heap Memory: Dynamically managed memory for objects and data structures whose size or lifetime is not known at compile time.
Data Flow: A program requests data or instructions using a virtual address. The MMU translates this to a physical address. The CPU first checks its L1, then L2, then L3 caches. If the data is found (a “cache hit”), it’s retrieved quickly. If not (a “cache miss”), the request goes to RAM. If the required data isn’t in RAM (a “page fault”), the OS must load it from secondary storage, which is a very slow operation.
How It Works: Step-by-Step Breakdown
Step 1: Program Execution & Memory Allocation
When you launch an application, the operating system loads its executable code and initial data into memory. As the program runs, it needs memory for variables, objects, and function calls. This memory is typically allocated in one of two primary areas: the Stack or the Heap.
- Stack Allocation: This is implicitly managed. When a function is called, a “stack frame” is pushed onto the stack. This frame contains the function’s local variables, parameters, and the return address. When the function completes, its stack frame is popped off, and the memory is automatically reclaimed.
- Heap Allocation: This is explicitly managed (or managed by a runtime’s garbage collector). When a program needs memory for data that must persist beyond the lifetime of a single function call, or whose size isn’t known at compile time (e.g., dynamic arrays, objects in Java/C#), it requests memory from the heap.
// C example demonstrating stack and heap allocation
#include <stdio.h>
#include <stdlib.h> // For malloc and free

void myFunction() {
    int stackVar = 10; // Allocated on the stack
    printf("Stack variable address: %p, value: %d\n", (void*)&stackVar, stackVar);
}

int main() {
    int mainStackVar = 20; // Allocated on the stack
    int *heapVar = (int *) malloc(sizeof(int)); // Allocated on the heap

    if (heapVar == NULL) {
        perror("Failed to allocate heap memory");
        return 1;
    }

    *heapVar = 30; // Assign value to heap memory

    printf("Main stack variable address: %p, value: %d\n", (void*)&mainStackVar, mainStackVar);
    printf("Heap variable address: %p, value: %d\n", (void*)heapVar, *heapVar);

    myFunction(); // Call function, its stack frame is pushed

    free(heapVar); // Explicitly free heap memory
    heapVar = NULL; // Good practice to nullify freed pointers

    // mainStackVar and stackVar (from myFunction) are automatically deallocated
    // when their respective functions return.
    return 0;
}
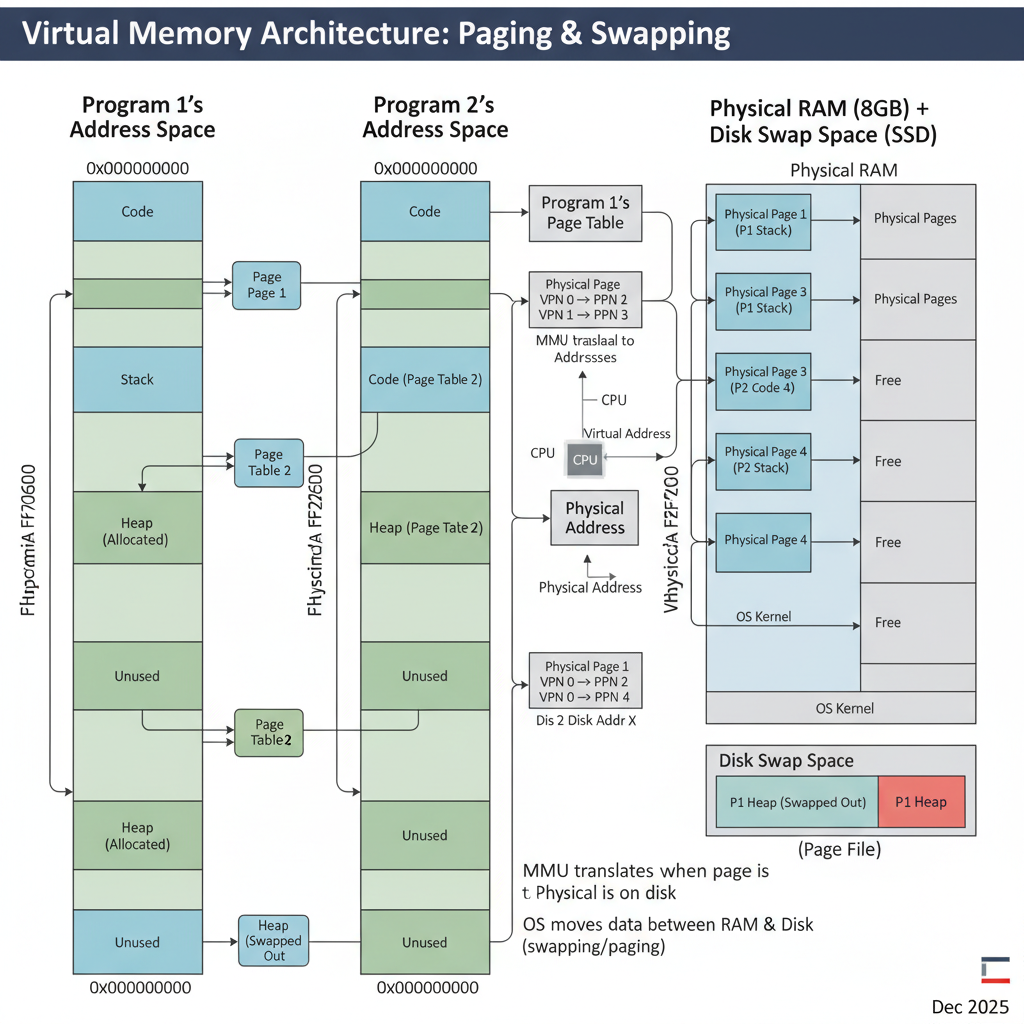
Step 2: Virtual Memory Translation
Programs don’t deal with physical RAM addresses directly. Instead, they operate within a virtual address space. This illusion is managed by the Operating System (OS) and the Memory Management Unit (MMU). When a program tries to access a virtual address, the MMU intercepts this request.
The MMU uses a Page Table, maintained by the OS, to translate the virtual address into a physical address. This table maps chunks of virtual memory (called “pages”, typically 4KB or larger) to chunks of physical memory (called “frames”).
The MMU first checks a special, fast cache called the Translation Lookaside Buffer (TLB). The TLB stores recent virtual-to-physical address translations. If a translation is found in the TLB (a “TLB hit”), the physical address is retrieved almost instantly. If not (a “TLB miss”), the MMU consults the slower Page Table in main memory.
Step 3: Paging & Disk Interaction
What if the virtual page a program tries to access isn’t currently in physical RAM? This is where paging comes in. When the MMU’s page table lookup indicates that a page is marked as “not present” in RAM, it triggers a page fault.
The OS then steps in:
- It suspends the program that caused the fault.
- It finds the required page on secondary storage (e.g., an SSD or HDD), which is designated as “swap space” or “page file.”
- It finds a free physical memory frame in RAM. If no frames are free, it must choose an existing page in RAM to “evict” (write back to disk if modified, then mark as not present). This is called page replacement.
- It loads the requested page from disk into the chosen physical frame.
- It updates the page table to reflect the new virtual-to-physical mapping.
- It resumes the suspended program, which can now access the data.
This process is transparent to the program but incurs a significant performance penalty due to slow disk I/O.
Step 4: CPU Cache Hierarchy
Once a physical address is determined (either directly from MMU or after a page fault), the CPU doesn’t immediately go to RAM. It first checks its multi-level cache hierarchy:
- L1 Cache: The smallest and fastest cache, typically split into instruction cache (L1i) and data cache (L1d). It’s located directly on the CPU core.
- L2 Cache: Larger and slightly slower than L1, typically shared between cores on a single CPU chip or dedicated per core.
- L3 Cache: The largest and slowest of the CPU caches, often shared across all cores on the CPU package.
Data is moved between these layers in fixed-size blocks called cache lines (e.g., 64 bytes). When data is requested, an entire cache line containing that data is brought into the cache. The hope is that subsequent accesses will find related data already in the cache (temporal and spatial locality). A “cache hit” is extremely fast, while a “cache miss” means fetching from a slower level, potentially all the way to RAM, which is orders of magnitude slower.
Step 5: Stack vs. Heap Memory Management
While virtual memory and caches handle the address translation and speed, the fundamental organization of a program’s data into stack and heap is crucial.
Stack:
- LIFO (Last-In, First-Out): Think of a stack of plates.
- Automatic Allocation: Managed by the compiler and OS.
- Fast: Pushing and popping are simple pointer adjustments.
- Limited Size: Typically much smaller than the heap.
- Local Variables, Function Calls: Stores function arguments, local variables, and return addresses.
- Contiguous: Memory is allocated in a contiguous block.
- Deterministic Lifetime: Memory is freed automatically when the scope ends.
Heap:
- Dynamic Allocation: Managed by the programmer (manual
malloc/freein C/C++,new/deletein C++/Java/C#) or by a runtime’s garbage collector. - Slower: Involves searching for available blocks, potential fragmentation.
- Large Size: Limited only by available virtual memory and swap space.
- Objects, Dynamic Data: Stores objects whose lifetime isn’t tied to a function call, dynamically sized arrays, etc.
- Non-Contiguous: Memory blocks can be scattered throughout the heap.
- Non-Deterministic Lifetime: Memory persists until explicitly freed or garbage collected.
- Dynamic Allocation: Managed by the programmer (manual
// C++ example for stack vs heap
#include <iostream>
#include <vector>

void processData(int val) {
    int local_val = val * 2; // local_val is on the stack
    std::cout << "Stack var (local_val): " << local_val << " at " << &local_val << std::endl;
} // local_val is deallocated here

int main() {
    int x = 10; // x is on the stack
    std::cout << "Stack var (x): " << x << " at " << &x << std::endl;

    int* ptr = new int; // Dynamically allocate an int on the heap
    *ptr = 20;
    std::cout << "Heap var (ptr points to): " << *ptr << " at " << ptr << std::endl;

    std::vector<int> myVector; // myVector object itself is on stack, its internal array is on heap
    myVector.push_back(1);
    myVector.push_back(2);
    std::cout << "Vector size: " << myVector.size() << std::endl;

    processData(x);

    delete ptr; // Explicitly deallocate heap memory
    ptr = nullptr; // Good practice

    // When main returns, x and myVector (and its heap data) are deallocated.
    return 0;
}
Deep Dive: Internal Mechanisms
Mechanism 1: Virtual Memory Management & Paging
The virtual memory system is a cornerstone of modern operating systems, providing crucial abstractions and resource management.
Page Tables: These are multi-level data structures (often tree-like) stored in RAM. Each process has its own page table. A virtual address is typically divided into parts: a page number and an offset within that page. The page number is used to index into the page table to find the corresponding physical frame number. The frame number is then combined with the offset to form the physical address.
Translation Lookaside Buffer (TLB): The TLB is a small, fast associative cache within the MMU. It stores recently used virtual-to-physical address translations. Because programs often access data sequentially or repeatedly (locality of reference), the TLB significantly speeds up address translation. A TLB miss is much faster than a page fault, but still involves a trip to main memory to consult the page table. When the OS switches between processes, the TLB must be flushed (or partially flushed) to prevent one process from using another’s translations.
Demand Paging: This is the technique where pages are only loaded into physical memory when they are actually accessed, not necessarily when the program starts. This optimizes memory usage, as many parts of a program (e.g., error handling routines) might never be executed.
Page Replacement Algorithms: When a page fault occurs and no free physical frames are available, the OS must decide which existing page to evict. Common algorithms include:
- LRU (Least Recently Used): Evicts the page that hasn’t been accessed for the longest time.
- FIFO (First-In, First-Out): Evicts the page that has been in memory the longest.
- Clock Algorithm: A more practical approximation of LRU, using a “use bit” to track recent access.
Mechanism 2: CPU Caches (L1, L2, L3)
CPU caches are vital for bridging the enormous speed gap between the CPU and RAM.
- Locality of Reference: Caches exploit two types of locality:
- Temporal Locality: If a piece of data is accessed, it’s likely to be accessed again soon.
- Spatial Locality: If a piece of data is accessed, data near it in memory is also likely to be accessed soon.
- Cache Lines: Data is transferred between RAM and caches in fixed-size blocks (e.g., 64 bytes). When a cache miss occurs, the entire cache line containing the requested data is brought into the cache.
- Cache Associativity:
- Direct-mapped: Each memory block can only go into one specific cache location. Simple but prone to conflict misses.
- Fully associative: A memory block can go into any cache location. Complex to implement, high power consumption.
- Set-associative: A compromise. Each memory block can go into any location within a specific “set” of cache lines. Most common.
- Cache Coherence: In multi-core systems, multiple cores might have copies of the same memory block in their private caches. Cache coherence protocols (e.g., MESI protocol) ensure that all cores see a consistent view of memory, even when one core modifies shared data. This involves invalidating other copies or updating them.
// C example illustrating cache line effects (simplified)
#include <stdio.h>
#include <stdlib.h>
#include <time.h>

#define SIZE 1024 * 1024 // 1 million integers
#define STRIDE 16 // Access every 16th element (simulating non-contiguous access)

int main() {
    int *arr = (int *)malloc(SIZE * sizeof(int));
    if (arr == NULL) {
        perror("Failed to allocate memory");
        return 1;
    }

    // Initialize array
    for (int i = 0; i < SIZE; i++) {
        arr[i] = i;
    }

    clock_t start, end;
    double cpu_time_used;

    // Test 1: Sequential access (good cache locality)
    start = clock();
    long long sum_seq = 0;
    for (int i = 0; i < SIZE; i++) {
        sum_seq += arr[i];
    }
    end = clock();
    cpu_time_used = ((double)(end - start)) / CLOCKS_PER_SEC;
    printf("Sequential access time: %f seconds\n", cpu_time_used);

    // Test 2: Strided access (poor cache locality if stride > cache line size)
    // Assuming int is 4 bytes, a 64-byte cache line holds 16 ints.
    // STRIDE = 16 means each access fetches a *new* cache line, leading to many cache misses.
    start = clock();
    long long sum_strided = 0;
    for (int i = 0; i < SIZE; i += STRIDE) {
        sum_strided += arr[i];
    }
    end = clock();
    cpu_time_used = ((double)(end - start)) / CLOCKS_PER_SEC;
    printf("Strided access time (stride %d): %f seconds\n", STRIDE, cpu_time_used);

    free(arr);
    return 0;
}
Observation: The strided access will typically be significantly slower than sequential access, demonstrating the impact of cache misses when data access patterns don’t align with cache line boundaries.
Mechanism 3: Garbage Collection (Basics)
Garbage Collection (GC) is an automatic memory management technique used in many modern programming languages (Java, C#, Python, JavaScript, Go, etc.). Its primary goal is to relieve programmers from the burden of manual memory deallocation, thereby reducing memory leaks and dangling pointer issues.
How it works: The GC runtime periodically identifies memory that is no longer “reachable” (i.e., no longer referenced by any active part of the program) and reclaims it.
Common GC Algorithms:
Mark-and-Sweep:
- Mark Phase: The GC starts from a set of “root” objects (e.g., global variables, objects on the stack) and traverses the object graph, marking all reachable objects.
- Sweep Phase: The GC then iterates through the entire heap, identifying unmarked objects (which are unreachable) and adds their memory back to the list of free memory.
- Pros: Relatively simple, can handle complex data structures.
- Cons: Can cause “stop-the-world” pauses (application execution halts during GC), can lead to heap fragmentation.
Copying Collectors (e.g., Generational GC):
- Divides the heap into two or more spaces (e.g., “From” space and “To” space).
- During collection, it copies all reachable objects from the “From” space to the “To” space.
- After copying, the entire “From” space is considered free.
- Pros: Eliminates fragmentation, efficient for short-lived objects (common in many applications, leading to “generational” GCs where new objects are in a “young generation” space).
- Cons: Requires twice the memory (at least temporarily) for the two spaces.
Performance Implications: While GC simplifies development, it’s not “free.” GC cycles consume CPU time and can introduce latency (pauses) into an application. Frequent or long GC pauses can severely impact application responsiveness. High Garbage Collection (GC) overhead is a common issue.
Hands-On Example: Building a Mini Version
Let’s create a very simplified C-like example to illustrate manual heap allocation/deallocation and the concept of a “memory leak.” This isn’t a full memory manager, but shows the core interaction.
#include <stdio.h>
#include <stdlib.h> // For malloc and free

// A simplified "memory manager" function
void* my_allocate(size_t size) {
    void* ptr = malloc(size);
    if (ptr == NULL) {
        perror("my_allocate: Failed to allocate memory");
    } else {
        printf("my_allocate: Allocated %zu bytes at address %p\n", size, ptr);
    }
    return ptr;
}

// A simplified "memory deallocator" function
void my_deallocate(void* ptr) {
    if (ptr != NULL) {
        printf("my_deallocate: Freeing memory at address %p\n", ptr);
        free(ptr);
    } else {
        printf("my_deallocate: Attempted to free NULL pointer.\n");
    }
}

// Function that causes a memory leak
void create_leak() {
    int* data = (int*)my_allocate(sizeof(int) * 100); // Allocate 100 integers
    if (data != NULL) {
        // We do something with data, but forget to free it.
        data[0] = 123;
        printf("create_leak: Data created at %p, first value %d\n", (void*)data, data[0]);
        // Memory pointed to by 'data' is now leaked when this function returns
        // because 'data' (a stack variable) goes out of scope, and we lose the pointer.
    }
}

// Function that correctly manages memory
void manage_memory_correctly() {
    char* buffer = (char*)my_allocate(sizeof(char) * 50); // Allocate 50 characters
    if (buffer != NULL) {
        buffer[0] = 'A';
        printf("manage_memory_correctly: Buffer created at %p, first char %c\n", (void*)buffer, buffer[0]);
        my_deallocate(buffer); // Correctly free the memory
    }
}

int main() {
    printf("--- Demonstrating correct memory management ---\n");
    manage_memory_correctly();
    printf("--- After correct memory management ---\n\n");

    printf("--- Demonstrating a memory leak ---\n");
    create_leak(); // This will leak memory
    printf("--- After memory leak function call ---\n");

    // The memory allocated in create_leak is now unreachable and cannot be freed.
    // This is a memory leak.

    // A stack variable:
    int stack_var = 5;
    printf("Main stack variable: %d at %p\n", stack_var, (void*)&stack_var);

    return 0;
}
Walk through the code line by line:
my_allocateandmy_deallocate: These are wrappers aroundmallocandfreeto log their actions, making it clear when memory is requested and returned to the OS.create_leak(): Inside this function,my_allocateis called to get a block of 100 integers from the heap. The pointerdataholds the address of this block. However, there’s no correspondingmy_deallocate(data)call. Whencreate_leak()finishes, thedatavariable (which lives on the stack) is destroyed. The memory block on the heap is still allocated, but we’ve lost the only pointer to it. The program can no longer free this memory, leading to a leak.manage_memory_correctly(): This function correctly allocates a buffer usingmy_allocateand then explicitly frees it usingmy_deallocatebefore the function returns.main(): Calls both functions. You’ll observe themy_allocatemessage forcreate_leakbut no correspondingmy_deallocate, indicating the leak.
Real-World Project Example
Let’s consider a Java application that processes large datasets. Java uses a Garbage Collector (GC), so manual malloc/free is not directly used by the programmer. However, understanding how objects are allocated on the heap and how GC works is critical for performance tuning and avoiding issues like OutOfMemoryError or high GC overhead.
import java.util.ArrayList;
import java.util.List;
import java.util.Random;

public class DataProcessor {

    // Represents a complex data object
    static class LargeDataObject {
        private byte[] data; // Stores a large array of bytes
        private String name;
        private int id;

        public LargeDataObject(int size, String name, int id) {
            this.data = new byte[size]; // Allocated on the heap
            this.name = name;           // String object also on heap
            this.id = id;               // Primitive int on stack (if local) or heap (as part of object)
            new Random().nextBytes(this.data); // Fill with random data
            // System.out.println("Created LargeDataObject: " + name + " (id: " + id + ") at " + this.hashCode());
        }

        // Simulate some processing
        public void process() {
            // Accessing data, potentially bringing cache lines into CPU cache
            for (int i = 0; i < 10; i++) { // Small loop to simulate
                if (data.length > i) {
                    byte b = data[i];
                }
            }
        }

        // Override finalize for demonstration (not recommended in modern Java)
        @Override
        protected void finalize() throws Throwable {
            // This is called by the GC before reclaiming the object
            // System.out.println("Finalizing LargeDataObject: " + name + " (id: " + id + ")");
            super.finalize();
        }
    }

    // This method simulates processing a batch of data
    public void processBatch(int numObjects, int objectSizeKB) {
        System.out.println("\n--- Processing Batch: " + numObjects + " objects of " + objectSizeKB + "KB each ---");
        List<LargeDataObject> activeObjects = new ArrayList<>(); // activeObjects list on heap

        for (int i = 0; i < numObjects; i++) {
            // Each LargeDataObject instance is allocated on the heap
            LargeDataObject obj = new LargeDataObject(objectSizeKB * 1024, "Object-" + i, i);
            activeObjects.add(obj); // Reference added to the list
        }

        // Simulate some work with the active objects
        System.out.println("Currently " + activeObjects.size() + " active objects.");
        for (LargeDataObject obj : activeObjects) {
            obj.process();
        }

        // Now, let's "discard" some objects to make them eligible for GC
        // For demonstration, we'll clear the list, making all objects unreachable.
        // In a real app, objects might naturally go out of scope or be removed from collections.
        System.out.println("Discarding active objects (making them eligible for GC)...");
        activeObjects.clear(); // This removes references, making objects unreachable.

        // Request GC hint (no guarantee it runs immediately)
        System.gc(); // Explicit GC call for demonstration. Avoid in production.

        System.out.println("Batch processing complete. Objects should now be eligible for GC.");
    }

    public static void main(String[] args) throws InterruptedException {
        System.out.println("Starting memory demonstration...");
        DataProcessor processor = new DataProcessor(); // processor object on heap

        // Scenario 1: Moderate allocation, objects become unreachable
        processor.processBatch(1000, 1); // 1000 objects, 1KB each = 1MB total

        // Give GC some time to potentially run
        Thread.sleep(100);

        // Scenario 2: Larger allocation, potentially stressing the heap
        // If this batch is too large for your JVM's heap, it might cause OutOfMemoryError
        // Try increasing JVM heap with -Xmx256m or higher if you get OOM
        processor.processBatch(5000, 5); // 5000 objects, 5KB each = 25MB total

        Thread.sleep(100);

        // Scenario 3: Simulate a memory leak (unintentionally holding references)
        System.out.println("\n--- Simulating a potential memory leak scenario ---");
        List<LargeDataObject> leakedObjects = new ArrayList<>();
        for (int i = 0; i < 100; i++) {
            LargeDataObject obj = new LargeDataObject(10 * 1024, "LeakedObject-" + i, i);
            leakedObjects.add(obj); // We keep adding to this list, never clearing it.
        }
        System.out.println("Created " + leakedObjects.size() + " 'leaked' objects that remain reachable.");
        System.out.println("These objects will NOT be garbage collected until 'leakedObjects' list itself becomes unreachable.");
        System.gc(); // Request GC, but these objects won't be collected.

        System.out.println("\nDemonstration finished.");
        // The 'leakedObjects' list (and the objects it references) will only be GC'd when 'main' exits
        // or if 'leakedObjects' itself is nullified or goes out of scope (which it doesn't here).
    }
}
Setup instructions:
- Save the code as
DataProcessor.java. - Compile using
javac DataProcessor.java. - Run using
java DataProcessor.- To observe
OutOfMemoryErroror GC behavior, you might want to limit the JVM’s heap size:java -Xmx64m DataProcessor(sets max heap to 64MB). Increase-Xmxif you get OOM too early.
- To observe
How to run and test:
Observe the console output. You’ll see messages indicating object creation and when batches are processed.
If you enable the System.out.println statements in LargeDataObject’s constructor and finalize method (by uncommenting them), you’ll get a clearer picture of when objects are created and when the GC might reclaim them.
You’ll notice that for processBatch, after activeObjects.clear(), the objects become eligible for GC. The System.gc() call hints to the JVM to run GC, and you might see finalize calls (though finalize is unreliable and not guaranteed).
For the “leak” scenario, even after System.gc(), the finalize calls for LeakedObject instances will not appear because the leakedObjects list still holds references to them, making them reachable and thus not eligible for collection.
What to observe:
- The creation of
LargeDataObjectinstances. Eachnew LargeDataObject(...)allocates memory on the Java heap. - The effect of
activeObjects.clear(): It severs the references from theArrayList, making theLargeDataObjectinstances unreachable. - The absence of
finalizecalls for “leaked” objects until themainmethod itself finishes, demonstrating how unintentionally held references prevent garbage collection (a common memory leak pattern in GC languages). - If you run with a small
-Xmxvalue, you might encounter anOutOfMemoryErrorduring the largerprocessBatchcall or the leak simulation, indicating that the JVM ran out of heap space.
Performance & Optimization
Memory performance is critical. Optimizing memory usage can lead to significant speedups.
- Cache-Aware Programming: Design data structures and algorithms to maximize cache hits. Access data sequentially whenever possible (spatial locality). Reuse data frequently (temporal locality). Avoid “cache thrashing” where frequently used data is constantly evicted from the cache.
- Memory Alignment: Ensure data structures are aligned to cache line boundaries (often 64 bytes). Misaligned access can cause multiple cache line fetches for a single data item. Compilers often handle this, but it’s important for custom memory allocators or low-level programming.
- False Sharing: In multi-threaded programs, if two threads frequently modify different variables that happen to reside on the same cache line, the cache coherence protocol will constantly invalidate and update that cache line between the CPUs. This “false sharing” can severely degrade performance. Padding structs to ensure independent variables are on different cache lines can mitigate this.
- Garbage Collector Tuning: For GC’d languages, understanding and tuning the GC is crucial. This involves selecting the right GC algorithm (e.g., G1, ZGC, ParallelGC in Java), configuring heap sizes (
-Xmx,-Xms), and monitoring GC logs to identify pauses and memory pressure. High GC overhead can be a sign of memory leaks or inefficient object creation. - Memory Pooling: For applications that frequently allocate and deallocate small, fixed-size objects, maintaining a custom memory pool can be faster than relying on the general-purpose heap allocator. This reduces fragmentation and allocation overhead.
- Stack vs. Heap Usage: Prefer stack allocation for small, short-lived data whenever possible due to its speed and automatic management. Use heap only when dynamic lifetime or size is required.
Common Misconceptions
- Virtual Memory is just “more RAM”: Virtual memory is an abstraction. It allows programs to address more memory than physically available by using disk space as a backing store, but it doesn’t magically create more fast RAM. Accessing swapped-out pages is much slower.
- Garbage Collection is free performance: GC simplifies memory management and prevents many bugs, but it’s not without cost. GC cycles consume CPU time, introduce pauses (latency), and can increase memory footprint due to overhead from tracking objects. High GC overhead is a common issue.
- Stack is always faster than Heap: While stack allocation/deallocation is generally faster due to simple pointer manipulation, the data itself might end up in the same CPU cache lines. The “speed” difference is primarily in the allocation/deallocation mechanism and the locality of reference for data. Heap data can also be very fast if it’s hot in the CPU caches.
- Memory leaks only happen in C/C++: While explicit
malloc/freemakes leaks obvious, GC’d languages can also suffer from memory leaks. These occur when objects are still reachable (e.g., held in a staticArrayListthat is never cleared) but are no longer functionally needed by the application. The GC cannot reclaim them because they are technically still referenced. - A program’s memory usage equals its RAM usage: Due to virtual memory and paging, a program’s reported “virtual size” might be very large, but its “resident set size” (RSS, the actual physical RAM it occupies) could be much smaller.
Advanced Topics
- NUMA (Non-Uniform Memory Access): In systems with multiple CPU sockets, each CPU might have its own local memory controller and a subset of the total RAM. Accessing memory local to a CPU is faster than accessing memory attached to another CPU. NUMA-aware programming is crucial for high-performance applications on such architectures.
- Memory Barriers (Fences): In multi-threaded programming, compilers and CPUs can reorder memory operations for optimization. Memory barriers are special instructions that enforce a specific order of memory operations, ensuring correct synchronization and visibility of changes across threads and CPU cores.
- Direct Memory Access (DMA): Allows peripheral devices (e.g., network cards, GPUs) to read from or write to main memory directly, without involving the CPU. This frees up the CPU for other tasks and improves I/O performance. Direct buffers are often used by applications for faster I/O operations.
- Memory-Mapped Files: A technique where a file on disk is mapped directly into a process’s virtual address space. The OS handles loading pages of the file into RAM as they are accessed, making file I/O behave like memory access.
Comparison with Alternatives
The primary “alternative” to the modern hierarchical memory system is direct, flat physical memory access, as seen in very old or embedded systems.
- Manual Memory Management (e.g., C/C++):
- Pros: Fine-grained control, potentially optimal performance, minimal runtime overhead.
- Cons: High risk of memory leaks, use-after-free errors, double-free errors, buffer overflows, and other memory-related bugs. Requires significant programmer discipline.
- Automatic Memory Management (Garbage Collection, e.g., Java, C#):
- Pros: Significantly reduces memory-related bugs, simplifies development, improves robustness.
- Cons: Runtime overhead from GC cycles, potential for “stop-the-world” pauses, less predictable performance, still susceptible to logical memory leaks (reachable but unused objects).
- Ownership and Borrowing (e.g., Rust):
- Pros: Achieves memory safety without a runtime GC. Memory is freed deterministically at compile time based on ownership rules.
- Cons: Steeper learning curve, requires careful design to satisfy borrow checker rules.
Each approach represents a different trade-off between performance, safety, and developer productivity. Modern systems often combine these: C/C++ for performance-critical components, Java/C# for application logic, and Rust for systems programming where both safety and performance are paramount.
Debugging & Inspection Tools
Understanding memory behavior is crucial for debugging. Here are some indispensable tools:
- Valgrind (Linux): A powerful instrumentation framework, especially its
memchecktool. It detects memory errors like:- Use of uninitialized memory
- Reading/writing off the end of heap blocks
- Use of freed memory
- Memory leaks (by reporting blocks that are still allocated but unreachable at program exit)
- GDB (GNU Debugger): Allows inspecting memory contents at specific addresses, setting watchpoints on memory locations, and stepping through code to observe memory changes.
- perf (Linux): A performance analysis tool that can track cache misses, TLB misses, page faults, and other hardware-level memory events, helping pinpoint performance bottlenecks.
- htop/top (Linux): Command-line utilities to monitor system-wide and per-process memory usage (virtual memory size, resident set size, shared memory).
- Java VisualVM / JConsole / YourKit / JProfiler (Java): Tools for monitoring JVM memory usage, heap dumps, garbage collection activity, and identifying memory leaks in Java applications. They provide detailed insights into heap object allocation, GC cycles, and object references.
- Windows Performance Monitor / Task Manager: Provides similar system-wide and per-process memory statistics on Windows.
- AddressSanitizer (ASan): A fast memory error detector integrated into compilers like GCC and Clang. It can detect out-of-bounds accesses, use-after-free, and other errors with lower overhead than Valgrind.
Key Takeaways
- Memory is Hierarchical: Modern systems use a multi-layered memory hierarchy (CPU caches, RAM, disk) to balance speed, capacity, and cost.
- Virtual Memory is Key: It provides isolation, abstraction, and the illusion of vast memory, managed by the OS and MMU through page tables and paging.
- Stack vs. Heap: Understand their fundamental differences in allocation, lifetime, and usage patterns. Stack is for automatic, short-lived data; Heap is for dynamic, long-lived data.
- CPU Caches are Critical: L1, L2, L3 caches minimize latency to RAM by storing frequently accessed data, relying on locality of reference. Cache misses are costly.
- Garbage Collection: Automates memory management in many languages, reducing bugs but introducing its own performance considerations (overhead, pauses). Logical memory leaks can still occur.
- Performance Implications: Memory access patterns, cache alignment, and GC tuning profoundly impact application speed.
- Debugging is Essential: Tools like Valgrind and profilers are vital for identifying and resolving memory-related issues.
This deep understanding of memory internals empowers you to write more efficient, reliable, and performant software, allowing you to troubleshoot complex issues with confidence.
References
- Memory: The Stack & The Heap
- A Deep Dive into the JVM Memory Model
- Java Memory Management Explained: Heap, Stack, Garbage Collection, and Optimization (2025 Guide)
- Stack Memory vs Heap Memory: What They Are and How to Tune Them in Web Applications
- Operating Systems Concepts by Silberschatz, Galvin, Gagne (General OS and memory management reference)
Transparency Note
This document was created by an AI expert to provide a comprehensive and technically accurate explanation of how memory works in modern systems, incorporating information up to December 2025. While efforts have been made to ensure accuracy and depth, specific implementation details may vary across different hardware architectures, operating systems, and programming language runtimes.